ACE HARDWARE REPORTS FOURTH QUARTER AND FULL YEAR 2025 RESULTS
PR Newswire
OAK BROOK, Ill., Feb. 18, 2026
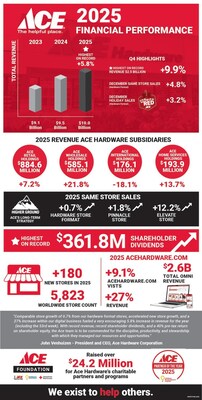
- Record fourth quarter revenues of $2.5 billion, an increase of 9.9 percent
- Record full year revenues of $10.0 billion, an increase of 5.8 percent
- Record patronage dividend to shareholders of $361.8 million
OAK BROOK, Ill., Feb. 18, 2026 /PRNewswire/ — Ace Hardware Corporation (“Ace” or the “Company”) today reported fourth quarter 2025 revenues of $2.5 billion, an increase of $226.7 million, or 9.9 percent, from the fourth quarter of 2024. Fiscal 2025 consisted of 53 weeks compared to 52 weeks in fiscal 2024. Excluding the 53rd week, revenues in the fourth quarter increased $107.3 million, or 4.7 percent, from the fourth quarter of 2024. Net income was $44.2 million for the fourth quarter of 2025, a decrease of $9.6 million from the fourth quarter of 2024. In the fourth quarter of 2024 the Company recorded a $17.8 million gain on the sale of the Company’s former Retail Support Center (“RSC”) in Little Rock, Arkansas that was partially offset by higher operating income in the fourth quarter of 2025.

Full year revenues were $10.0 billion, an increase of $552.2 million, or 5.8 percent, from 2024 revenue (an increase of $432.8 million or 4.6 percent excluding the 53rd week). Net income was $293.4 million for fiscal 2025, a decrease of $20.7 million, from fiscal 2024. This decrease is the result of $20.6 million in non-recurring asset impairment and shut-down charges recognized in fiscal 2025 related to the Company’s international operations. A significant improvement in operating income from the revenue increase in fiscal 2025 was offset by higher interest expense of $8.1 million from higher average borrowings and lower other income as the prior year included the $17.8 million gain on sale of the Company’s former RSC located in Little Rock, Arkansas.
“Comparable store growth of 0.7 percent from our hardware format stores, accelerated new store growth, and a 27 percent increase within our digital business fueled a very encouraging 5.8 percent increase in revenue for the year (including the 53rd week),” said John Venhuizen, President and CEO. “With record revenue, record shareholder dividends, and a 40 percent pre-tax return on shareholder equity, the Ace team is to be commended for the discipline, productivity, and stewardship with which they managed our resources and opportunities.”
The approximately 3,900 Ace retailers who share daily retail sales data reported a 0.1 percent decrease in U.S. retail same store sales during the fourth quarter of 2025, which was the result of a 1.9 percent decrease in same-store transactions; partially offset by a 1.8 percent increase in average ticket. For the full year, U.S. retail same-store sales increased 0.2 percent, which was the result of a 1.6 percent increase in average ticket; partially offset by a 1.3 percent decrease in same-store transactions.
Revenues
Fourth Quarter
Consolidated revenues for the three months ended January 3, 2026 totaled $2.5 billion. Total wholesale revenues were $2.3 billion, an increase of $207.6 million, or 10.0 percent, as compared to the prior year fourth quarter. Increases were seen across most departments with lawn and garden, power tools, bulbs and batteries and hardware showing the largest gains.
Wholesale merchandise revenues to new domestic Ace stores activated from January 2024 through December 2025 contributed $65.0 million of incremental revenues during the fourth quarter of 2025, while wholesale merchandise revenues decreased $9.3 million during the fourth quarter due to domestic Ace stores whose memberships were cancelled. Wholesale merchandise revenues to comparable domestic Ace stores increased $107.5 million for the quarter. The Company’s Ace Hardware International Holdings, Ltd. (“AIH”) subsidiary experienced a $7.0 million decrease in wholesale revenue from the fourth quarter of 2024. Ace Wholesale Holdings LLC (“AWH”) reported a $17.2 million increase in wholesale revenues from the fourth quarter of 2024 primarily due to higher sales to pro lumber and hardware customers. The Company’s Ace Services Holdings LLC (“ASH”) subsidiary, which is reported as part of the Company’s wholesale business, experienced a $7.2 million increase in revenues from the fourth quarter of 2024.
Total retail revenues from Ace Retail Holdings LLC (“ARH”) for the quarter were $221.5 million, an increase of $19.1 million, or 9.4 percent, as compared to the prior year fourth quarter. The Great Lakes Ace Hardware (“GLA”) chain experienced an 8.6 percent increase in same-store sales while the Westlake Ace Hardware (“Westlake”) chain experienced a 0.9 percent decrease in same-store sales in the quarter. The new stores opened by ARH in 2024 and 2025 contributed $8.3 million of incremental revenues during the fourth quarter of 2025. ARH operated 268 stores at the end of the fourth quarter of 2025 compared to 259 stores at the end of the fourth quarter of 2024.
Fiscal Year
Consolidated revenues for fiscal 2025 totaled $10.0 billion, an increase of $552.2 million, or 5.8 percent, as compared to the prior year. Total wholesale revenues were $9.2 billion, an increase of $493.0 million, or 5.7 percent, as compared to the prior year. Increases were seen across many departments with lawn and garden, impulse, fertilizer, grilling and power tools showing the largest gains.
Wholesale merchandise revenues from new domestic Ace stores were $260.5 million in fiscal 2025. This increase was partially offset by a decrease in wholesale merchandise revenues of $44.2 million due to domestic Ace store cancellations. Wholesale merchandise revenues to comparable domestic Ace stores increased $81.3 million in fiscal 2025 compared to fiscal 2024. AIH wholesale revenues decreased $38.9 million compared to the prior year, primarily due to the loss of what had been AIH’s largest customer. AWH wholesale revenues increased $104.6 million compared to the prior year primarily due to higher sales to pro lumber, hardware and e-commerce customers. ASH wholesale revenues increased $22.1 million from the fourth quarter of 2024.
Total retail revenues from ARH were $884.6 million, an increase of $59.2 million, or 7.2 percent, as compared to the prior year. The GLA chain experienced a 3.6 percent increase in same-store sales while the Westlake chain experienced a 0.2 percent decrease in same-store sales in fiscal 2025. The new stores opened by ARH in 2024 and 2025 contributed $54.5 million of incremental revenues during fiscal 2025.
Ace added 180 new domestic stores in fiscal 2025 and cancelled 74 stores. This brought the Company’s total domestic store count to 5,250 at the end of fiscal 2025, an increase of 106 stores from the end of fiscal 2024.
Gross Profit
Fourth Quarter
Wholesale gross profit for the three months ended January 3, 2026 was $296.2 million, an increase of $28.8 million from the fourth quarter of 2024. The wholesale gross margin percentage was 12.9 percent of wholesale revenues in the fourth quarter of 2025, up slightly from 12.8 percent in the fourth quarter of 2024.
Retail gross profit for the three months ended January 3, 2026 was $102.0 million, an increase of $9.6 million from the fourth quarter of 2024. The retail gross margin percentage was 46.0 percent of retail revenues in the fourth quarter of 2025, up from 45.7 percent in the fourth quarter of 2024. For ARH, retail gross profit is based on the Company’s wholesale acquisition cost of product, not ARH’s acquisition cost which includes a markup from the Company.
Fiscal Year
Wholesale gross profit for fiscal 2025 was $1.3 billion, an increase of $97.6 million from fiscal 2024. The wholesale gross margin percentage was 13.8 percent of wholesale revenues in fiscal 2025, up from 13.5 percent in fiscal 2024.
Retail gross profit for fiscal 2025 was $405.0 million, an increase of $30.3 million from fiscal 2024. The retail gross margin percentage was 45.8 percent of retail revenues in fiscal 2025, up from 45.4 percent in fiscal 2024. For ARH, retail gross profit is based on the Company’s wholesale acquisition cost of product, not ARH’s acquisition cost which includes a markup from the Company.
Expenses and Other
Fourth Quarter
Wholesale operating expenses increased $12.3 million, or 5.1 percent, from the fourth quarter of 2024. The increase is due to an increase in marketing and advertising spending and higher compensation benefit expense. As a percentage of wholesale revenues, wholesale operating expenses decreased to 11.2 percent of wholesale revenues in the fourth quarter of 2025 from 11.7 percent of wholesale revenues in the fourth quarter of 2024.
Retail operating expenses increased $12.4 million, or 16.1 percent, from the fourth quarter of 2024. The increase was primarily driven by expenses incurred related to the new stores added since the end of the third quarter of 2024. Retail operating expenses as a percentage of retail revenue increased to 40.3 percent in the fourth quarter of 2025 from 37.9 percent in the fourth quarter of 2024, primarily due to higher compensation benefit expense and higher occupancy costs.
Other income, net decreased $22.4 million from the fourth quarter of 2024. The decrease is primarily due to the $17.8 million gain on sale of the Company’s former RSC located in Little Rock, Arkansas recorded during the fourth quarter of 2024.
Fiscal Year
Wholesale operating expenses increased $94.3 million, or 10.2 percent, in fiscal 2025 as compared to fiscal 2024. Included in this increase were non-recurring asset impairment and shut-down charges of $20.6 million related to AIH. The remaining increase was primarily driven by higher compensation benefit expenses and planned increases in marketing, advertising and supply chain spending. As a percentage of wholesale revenues, wholesale operating expenses increased to 11.1 percent in fiscal 2025 from 10.7 percent in fiscal 2024. Excluding the $20.6 million of non-recurring AIH charges, wholesale operating expenses were 10.9 percent of wholesale revenues.
Retail operating expenses increased $33.7 million, or 11.3 percent, in fiscal 2025 as compared to fiscal 2024. This increase is driven by expenses incurred related to new stores added in 2024 and 2025. Retail operating expenses as a percentage of retail revenue increased to 37.5 percent in fiscal 2025 from 36.1 percent in fiscal 2024.
Interest expense increased $8.1 million in fiscal 2025 due to higher average borrowings.
Other income, net decreased $13.9 million in fiscal 2025 compared to fiscal 2024. The decrease is due to the $17.8 million gain on sale of the Company’s former RSC located in Little Rock, Arkansas recorded in fiscal 2024, partially offset by gains on long term investments recognized in fiscal 2025.
Balance Sheet and Cash Flow
Long-term debt, including current maturities, increased $140.1 million from 2024. At the end of 2025, long-term debt consisted of $374.5 million outstanding on the revolving credit facility, $41.8 million outstanding on the ARH credit facility and $50.9 million owed to former retailers. Total equity was $900.1 million.
About Ace Hardware
Ace Hardware is the largest hardware cooperative in the world, serving more than 8,800 locally owned and operated stores around the globe, while providing the best products, services, and operating methods to over 5,200 Ace retail stores in the United States. Ace Hardware’s family of brands includes Ace Hardware, Emery Jensen Distribution, and independent retailers worldwide. Headquartered in Oak Brook, Illinois, Ace operates an expansive network of U.S. distribution centers, along with international capabilities in Ningbo, China, and Cuautitlán Izcalli, Mexico. Since 1924, Ace has been a part of local communities, known as the place with the helpful hardware folks. For more information, visit acehardware.com or newsroom.acehardware.com.
Contacts:
Shareholders’/Investors’ Inquiries:
William Guzik, Executive Vice President, Chief Financial Officer & Chief Risk Officer
630-990-3325, guzik@acehardware.com
Media Inquiries:
Jeff Gooding, Vice President, Consumer Marketing
630-990-3600, media@acehardware.com
|
ACE HARDWARE CORPORATION CONSOLIDATED STATEMENTS OF INCOME (In millions) |
||||||||
|
Three Months Ended |
Twelve Months Ended |
|||||||
|
January 3, |
December 28, |
January 3, |
December 28, |
|||||
|
2026 |
2024 |
2026 |
2024 |
|||||
|
(14 Weeks) |
(13 Weeks) |
(53 Weeks) |
(52 Weeks) |
|||||
|
Revenues: |
||||||||
|
Wholesale revenues |
$ 2,292.1 |
$ 2,084.5 |
$ 9,159.0 |
$ 8,666.0 |
||||
|
Retail revenues |
221.5 |
202.4 |
884.6 |
825.4 |
||||
|
Total revenues |
2,513.6 |
2,286.9 |
10,043.6 |
9,491.4 |
||||
|
Cost of revenues: |
||||||||
|
Wholesale cost of revenues |
1,995.9 |
1,817.1 |
7,891.0 |
7,495.6 |
||||
|
Retail cost of revenues |
119.5 |
110.0 |
479.6 |
450.7 |
||||
|
Total cost of revenues |
2,115.4 |
1,927.1 |
8,370.6 |
7,946.3 |
||||
|
Gross profit: |
||||||||
|
Wholesale gross profit |
296.2 |
267.4 |
1,268.0 |
1,170.4 |
||||
|
Retail gross profit |
102.0 |
92.4 |
405.0 |
374.7 |
||||
|
Total gross profit |
398.2 |
359.8 |
1,673.0 |
1,545.1 |
||||
|
Wholesale operating expenses: |
||||||||
|
Distribution operations expenses |
77.0 |
76.4 |
306.4 |
288.6 |
||||
|
Selling, general and administrative expenses |
94.5 |
90.0 |
384.9 |
342.4 |
||||
|
Retailer success and development expenses |
84.2 |
77.0 |
328.3 |
294.3 |
||||
|
Retail operating expenses |
89.2 |
76.8 |
331.4 |
297.7 |
||||
|
Retail pre-opening expenses |
0.6 |
1.0 |
2.2 |
4.8 |
||||
|
Total operating expenses |
345.5 |
321.2 |
1,353.2 |
1,227.8 |
||||
|
Operating income |
52.7 |
38.6 |
319.8 |
317.3 |
||||
|
Interest expense |
(14.9) |
(12.8) |
(57.0) |
(48.9) |
||||
|
Interest income |
2.0 |
1.9 |
7.0 |
6.9 |
||||
|
Other income, net |
3.0 |
25.4 |
22.6 |
36.5 |
||||
|
Income tax benefit |
1.4 |
0.7 |
1.0 |
2.3 |
||||
|
Net income |
44.2 |
53.8 |
293.4 |
314.1 |
||||
|
Less: net loss attributable to noncontrolling interests |
(3.8) |
– |
(5.1) |
(0.9) |
||||
|
Net income attributable to Ace Hardware Corporation |
$ 48.0 |
$ 53.8 |
$ 298.5 |
$ 315.0 |
||||
|
Patronage distributions accrued |
$ 67.6 |
$ 65.8 |
$ 361.8 |
$ 357.0 |
||||
|
Patronage distributions accrued for third party Retailers |
$ 60.5 |
$ 59.6 |
$ 339.6 |
$ 335.6 |
||||
|
ACE HARDWARE CORPORATION CONSOLIDATED BALANCE SHEETS (In millions, except share data) |
|||||
|
January 3, |
December 28, |
||||
|
2026 |
2024 |
||||
|
Assets |
|||||
|
Cash and cash equivalents |
$ 46.8 |
$ 36.3 |
|||
|
Marketable securities |
40.5 |
42.7 |
|||
|
Receivables, net of allowance for doubtful accounts of $17.0 and $10.9, respectively |
739.9 |
727.8 |
|||
|
Inventories |
1,200.8 |
1,197.9 |
|||
|
Prepaid expenses and other current assets |
89.9 |
87.3 |
|||
|
Total current assets |
2,117.9 |
2,092.0 |
|||
|
Property and equipment, net |
746.4 |
594.6 |
|||
|
Operating lease right-of-use assets, net |
742.5 |
798.2 |
|||
|
Finance lease right-of-use assets, net |
171.4 |
185.7 |
|||
|
Goodwill and other intangible assets |
464.7 |
455.6 |
|||
|
Other assets |
202.4 |
166.7 |
|||
|
Total assets |
$ 4,445.3 |
$ 4,292.8 |
|||
|
Liabilities and Equity |
|||||
|
Current maturities of long-term debt |
$ 63.4 |
$ 80.6 |
|||
|
Accounts payable |
1,188.5 |
1,215.2 |
|||
|
Patronage distributions payable in cash |
139.0 |
137.2 |
|||
|
Patronage refund certificates payable |
24.3 |
15.0 |
|||
|
Current operating lease liabilities |
102.5 |
94.4 |
|||
|
Current finance lease liabilities |
43.4 |
37.9 |
|||
|
Accrued expenses |
337.7 |
313.1 |
|||
|
Total current liabilities |
1,898.8 |
1,893.4 |
|||
|
Long-term debt |
403.8 |
246.5 |
|||
|
Patronage refund certificates payable |
250.5 |
205.8 |
|||
|
Long-term operating lease liabilities |
673.7 |
728.4 |
|||
|
Long-term finance lease liabilities |
123.8 |
145.0 |
|||
|
Other long-term liabilities |
194.6 |
151.8 |
|||
|
Total liabilities |
3,545.2 |
3,370.9 |
|||
|
Member Retailers’ Equity: |
|||||
|
Class A voting common stock, $1,000 par value, 10,000 shares authorized, 2,586 and 2,586 issued and outstanding, respectively |
2.6 |
2.6 |
|||
|
Class C nonvoting common stock, $100 par value, 20,000,000 shares authorized 7,757,661 and 7,528,693 issued and outstanding, respectively |
775.8 |
752.9 |
|||
|
Class C nonvoting common stock, $100 par value, issuable to Retailers for patronage distributions, 815,156 and 825,206 shares issuable, respectively |
81.5 |
82.5 |
|||
|
Contributed capital |
18.9 |
19.3 |
|||
|
Retained earnings |
17.9 |
58.5 |
|||
|
Accumulated other comprehensive income (loss) |
0.6 |
(1.9) |
|||
|
Equity attributable to Ace member Retailers |
897.3 |
913.9 |
|||
|
Equity attributable to noncontrolling interests |
2.8 |
8.0 |
|||
|
Total equity |
900.1 |
921.9 |
|||
|
Total liabilities and equity |
$ 4,445.3 |
$ 4,292.8 |
|||
|
ACE HARDWARE CORPORATION CONSOLIDATED STATEMENTS OF CASH FLOWS (In millions) |
||||
|
Twelve Months Ended |
||||
|
January 3, |
December 28, |
|||
|
2026 |
2024 |
|||
|
(53 Weeks) |
(52 Weeks) |
|||
|
Operating Activities |
||||
|
Net income |
$ 293.4 |
$ 314.1 |
||
|
Adjustments to reconcile net income to net cash provided by operating activities: |
||||
|
Depreciation and amortization |
108.6 |
99.7 |
||
|
Non cash lease expense |
45.4 |
32.2 |
||
|
Amortization of deferred financing costs |
0.9 |
0.9 |
||
|
Loss (gain) on disposal of assets, net |
1.5 |
(16.0) |
||
|
Provision for doubtful accounts |
11.1 |
2.0 |
||
|
Deferred taxes |
(2.4) |
(1.6) |
||
|
Other, net |
10.6 |
0.6 |
||
|
Changes in operating assets and liabilities, exclusive of effect of acquisitions: |
||||
|
Receivables |
(75.5) |
(78.5) |
||
|
Inventories |
2.2 |
54.9 |
||
|
Other current assets |
(2.6) |
(17.4) |
||
|
Other long-term assets |
(12.4) |
(18.6) |
||
|
Accounts payable and accrued expenses |
7.7 |
149.7 |
||
|
Other long-term liabilities |
11.3 |
26.1 |
||
|
Net cash provided by operating activities |
399.8 |
548.1 |
||
|
Investing Activities |
||||
|
Purchases of investment securities |
(9.6) |
(24.6) |
||
|
Proceeds from sale of investment securities |
9.8 |
30.0 |
||
|
Purchases of property and equipment |
(226.9) |
(155.4) |
||
|
Cash paid for acquired businesses, net of cash acquired |
(17.8) |
(58.6) |
||
|
Increase in notes receivable, net |
(31.3) |
(37.3) |
||
|
Proceeds from sale of assets |
0.8 |
22.7 |
||
|
Other, net |
(1.0) |
0.4 |
||
|
Net cash used in investing activities |
(276.0) |
(222.8) |
||
|
Financing Activities |
||||
|
Net borrowings (payments) under revolving lines of credit |
139.7 |
(85.3) |
||
|
Principal payments on long-term debt |
(22.6) |
(21.1) |
||
|
Principal portion of finance lease payment |
(52.7) |
(40.3) |
||
|
Payments of debt issuance costs |
(0.4) |
– |
||
|
Payments of cash portion of patronage distribution |
(137.8) |
(137.1) |
||
|
Payments of patronage refund certificates |
(28.8) |
(22.9) |
||
|
Repurchase of stock |
(12.2) |
(15.1) |
||
|
Purchase of noncontrolling interests |
(1.2) |
(0.9) |
||
|
Other, net |
2.7 |
1.8 |
||
|
Net cash used in financing activities |
(113.3) |
(320.9) |
||
|
Increase in cash and cash equivalents |
10.5 |
4.4 |
||
|
Cash and cash equivalents at beginning of period |
36.3 |
31.9 |
||
|
Cash and cash equivalents at end of period |
$ 46.8 |
$ 36.3 |
||
|
Supplemental disclosure of cash flow information: |
||||
|
Interest paid |
$ 50.6 |
$ 39.4 |
||
|
Income taxes paid |
$ 5.3 |
$ 7.9 |
||
![]()
![]() View original content to download multimedia:https://www.prnewswire.com/news-releases/ace-hardware-reports-fourth-quarter-and-full-year-2025-results-302691187.html
View original content to download multimedia:https://www.prnewswire.com/news-releases/ace-hardware-reports-fourth-quarter-and-full-year-2025-results-302691187.html
SOURCE Ace Hardware Corporation